Last updated: 2 March 2022
Following on from the development of our Industry Report: Assessing pandemic impact on freight and logistics for the Victorian Healthtech Industry, BioMelbourne Network continues to maintain close contact with the Victorian Government and Global Victoria to monitor the situation and ongoing activities to support the sector at both the State and Federal level.
There are activities and programs that will have a positive impact on the situation regarding freight and logistics for the Healthtech Industry. Equally, there will be other areas where changes will require businesses to adjust to meet the challenges posed by the shifting landscape. We plan to provide you with the latest news, relevant links to industry export trends and where available, indicative pricing updates.
March 2022
- The extension of IFAM until 30 June 2022 (with an operational tail to end July 2022) has provided businesses with extra time and support, giving them the opportunity to transition to different and more resilient operating models.
- Consistent with other COVID-19 emergency responses, Australian businesses need to transition from reliance on emergency assistance and adjust to a recalibrated international trading environment.
- Beyond IFAM, the Australian Government will work with industry to assist businesses to adapt to the new international trade environment, modernise operations to align with new supply chains and ensure businesses are ready to capitalise on opportunities as they emerge.
- Any extension of IFAM is a matter for the Federal Government and not something that IFAM is in a position to comment on directly. Similarly, any requests from industry regarding an extension of IFAM beyond 30 June 2022 are also a matter for the Federal Government.
- IFAM continues to be committed to working with industry if you have any immediate concerns or questions.
- For more information on IFAM, visit the IFAM webpage or contact the team directly at Airfreight@austrade.gov.au
-
- If you want to view the currently supported flights and see the associated freight rates, you can download the IFAM FLIGHT SCHEDULE OUTBOUND or the IFAM FLIGHT SCHEDULE INBOUND which can be found at through the IFAM webpage link above.
Additional data
The DFAT statistical pivot tables are a great source for up-to-date export data at a product level. These are classified in a number of different ways, including by SITC (UN Standard International Trade Classification), TRIEC (DFAT’s Trade Import Export Classification), AHECC (Australian Harmonised Export Commodity Classification, and HTISC (Harmonised Tariff Item Stat-key Classification). These tables are available either by calendar year or financial year.
Two of the most relevant SITC codes indicate that:
- Code 541 – Pharmaceutical products (excl. medicaments) exports were worth $1.2 billion in calendar year 2021, a decrease of 49% compared to the value in 2020 ($2.4 billion).
- Code 542 – Medicaments (incl. veterinary) exports were worth $512 million in calendar year 2021, a decrease of 18% compared to the value in 2020 ($627 million).
The link to the source can be found here. The data comes from monthly merchandise trade data produced by the Australian Bureau of Statistics (ABS), with minor adjustments made by the Department of Foreign Affairs and Trade (DFAT). Small revisions to the data can be made up to 6 months after their initial release.
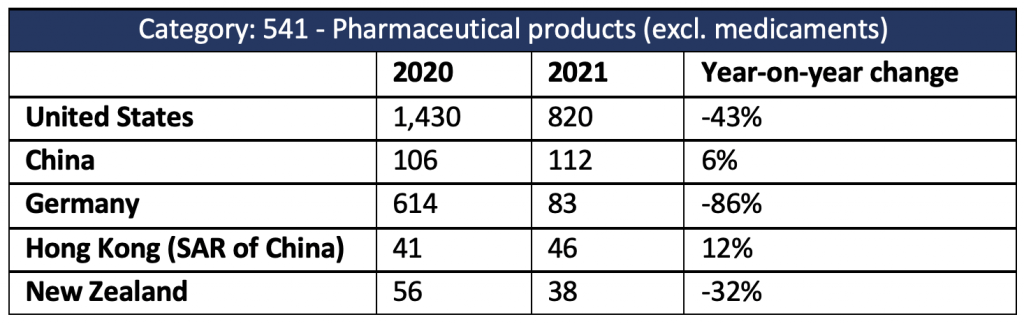
The table below shows Victoria’s top export markets for Pharmaceuticals (category 541) in 2021, as well as the YoY change compared to 2020. Export values are in $ million (i.e. exports to the US were $1.43 billion in 2020 and $820 million in 2021 – a 43% decline).
The ABS also produces a product called Stat Explorer, which allows users to filter through monthly import and export data at a 3-digit SITC level. That can be found here.
An additional data source that may be useful is the Australian Government’s new National Freight Data Hub (noting it is still a prototype), developed as part of the National Freight and Supply Chain Strategy. It allows users to drill down into exports and imports by air and sea freight, Australian state of origin/destination, and a very granular commodity level. This is a useful source as it provides both values and volumes. Please note this also uses SITC codes. A link can be found here.
Finally, the Australian Government’s Department of Infrastructure, Transport, Regional Development and Communications publishes monthly aviation statistics which cover operated flights and seats by airport, city pair, airline, route, country and region. It also includes monthly aircraft, passenger and freight movements. A link can be found here.
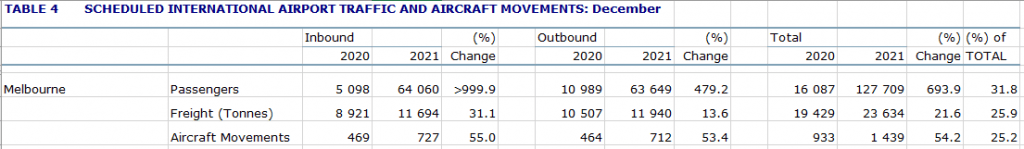
For example, Table 4 under the International Airline Activity – Monthly Publications shows:
- Melbourne Airport had 11,940 tonnes of outbound freight in December 2021 – a 13.6% increase compared to December 2020. Additionally, international outbound aircraft movements totalled 712, a 53.4% increase compared to December 2020.
Here is a screenshot of the data: