30 January 2020
Poised for Rockstar status as a Science & Technology Biomedical cluster
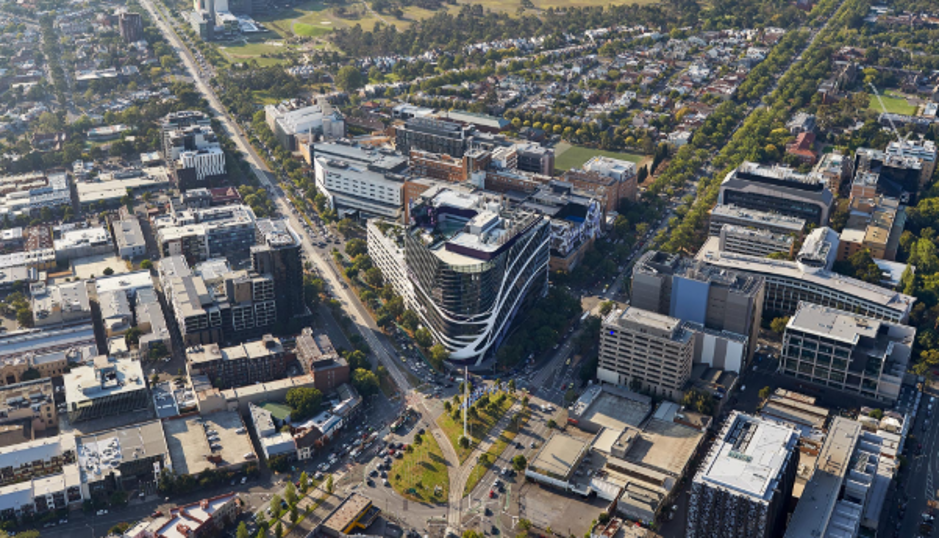
Every year the Global Innovation Index ranks the innovation performance of around 130 economies globally. The picture from the Global Innovation Index reflects that never have we had so many scientists across the world focused on solving the most pressing medical scientific challenges.
In 2017, global government expenditures in R&D (GERD) grew by about 5%, while business R&D expenditures grew by 6.7%, the largest increase since 20111&2.
Back home in Melbourne, with the present stagnant economic growth, what innovation goals can we expect in the new decade?
Melbourne is well placed with the right mix of medical innovation potential backed by several successes in the last decade to become a global powerhouse.
Particularly, in the Melbourne Biomedical Precinct (MBP) with co- location of over 11,000 researchers working in hospitals, research institutes, industry and universities. We have a neighbourhood hub of undergraduate, post-graduate training in medical research, cross disciplinary business development groups, talented translational catalysts as well as established global industry groups. All these stakeholders are focused on translation via innovative medical and MedTech research.
It is widely recognised that people-centred precincts or clusters work. In fact, international high performing precincts do well in combining clinical, academic and industry presence.
The MBP has comprehensive academic and industry memberships across the city not only in urbane Parkville. Much translational success is also very apparent in Clayton and the Commercial Road medical research clusters.
The Global Innovation Index ranks Melbourne 35th on the top 100 list of the world’s largest science & technology (S&T) clusters
At government level, we have the MBP office, the City of Melbourne and the Victorian Planning Authority progressing on a framework vison plan to drive healthcare advances, growth and jobs.
Today, as measured globally, Melbourne ranks as a top economic cluster based on our innovation environment and outputs.
Tables 1a & b show the top field of scientific publishing, the top organisations with which scientific authors are affiliated, the top patenting field, and the top patent applicant. The data illustrates the diversity of clusters around the world in terms of the technology fields represented and the entities generating most science and technology output.
Whilst medical technology appears as a top field, here at 35, Melbourne has General Medicine as the ‘top science field’ and The University of Melbourne ranked high in publishing performance. The top patenting field is ‘Pharmaceuticals’ with Monash University as the top patent applicant. It’s worth casting an eye on how early science and publishing is implicit to building the intelligence needed for expediting innovation
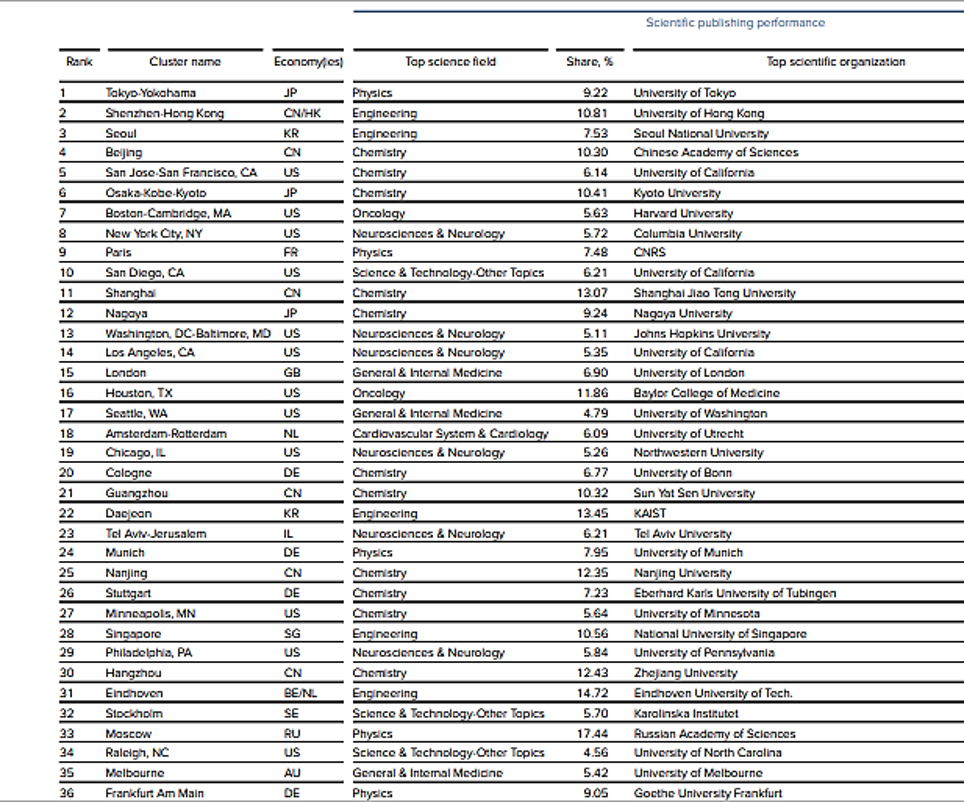
Table 1a. Top 36 Cluster Rankings, Global Innovation Index 2019 edition
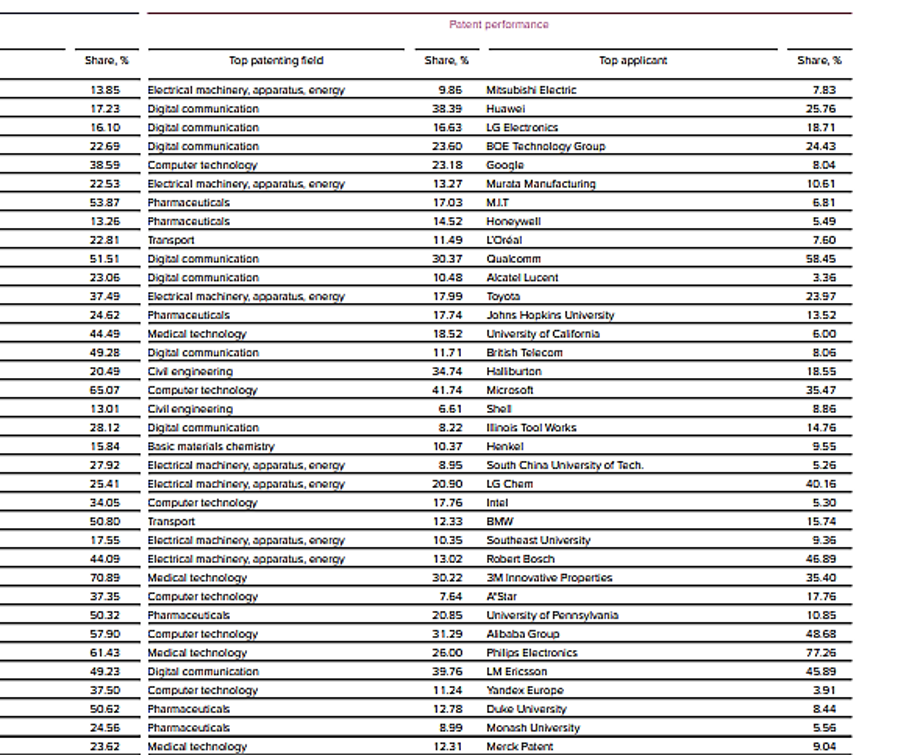
Table 1b. Continued: Top 36 Cluster Rankings, Global Innovation Index 2019 edition
Reference: WIPO Statistics Database, March 2019. Uses Derwent Index, Incites & Cortellis Competitive Intelligence All Clarivate products
Notes:
S&T activity is central to innovation performance, it naturally focuses on the upstream segments of the innovation value chain.
Two factors may explain rank changes from one year to the next. Firstly, changes may be due to changes in the volume of patent applications and scientific publications during the two-time frames. Secondly, rank changes may be due to a growing or shrinking cluster geography. It is important to note that geographical shifts may be sensitive to the threshold used in the Global Innovation Index clustering algorithm.
Patent filing and scientific publication shares refer to the 2013 – 2017 timeframe and are based on fractional counts, as explained in the text. Codes refer to the ISO-2 codes
https://www.globalinnovationindex.org/gii-2019-report#
Chart 1 below demonstrates the concentration of top science and technology clusters globally. Noise refers to all inventor / researcher locations not classified in a cluster. Melbourne and Australia are competing on the world stage. However, more noise is required through national partnerships and international collaborations to reposition the Melbourne cluster up the global ranks.
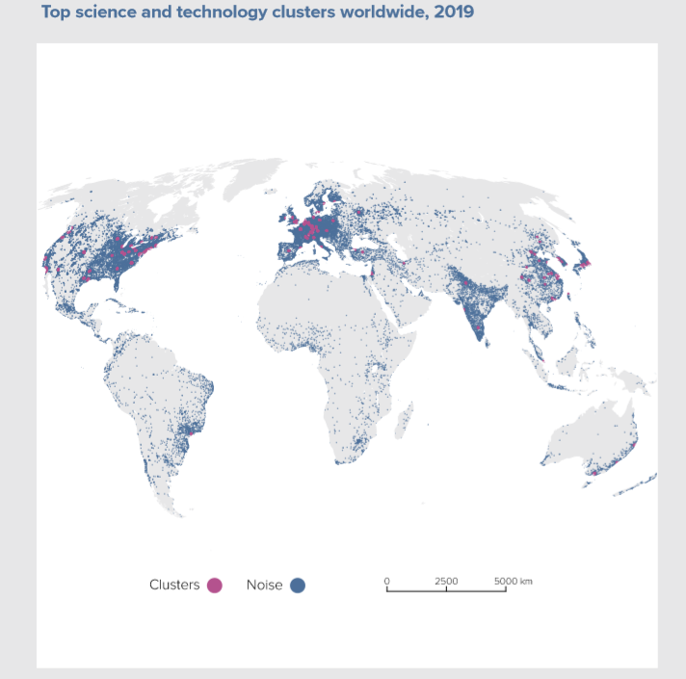
Chart 1. Top Science Technology cluster worldwide, Global Innovation Index 2019 edition
Nonetheless, a micro view of the Melbourne Parkville precinct suggests that our discovery and innovation to translation capabilities brings skin in the game when comparing ourselves to other top global precincts.
Chart 2 shows Total number of publications by precinct in 20 years (2000 – 2019).
Chart 3 demonstrates the Percentage of publications in the top 1% and 10% by number of citations when normalized to category and year for each Biomedical Precinct in 20 years (2000-2019)
Lastly, Chart 4 exemplifies the clear outpacing of the Parkville based groups of the Melbourne Biomedical Precinct by the likes of Cambridge and Stanford and others in Percentage of Industry Collaborations by precinct in 20 years. One area where we rank well is Percentage of International collaborations in 20 years, with the UK holding the lion share (chart 5).
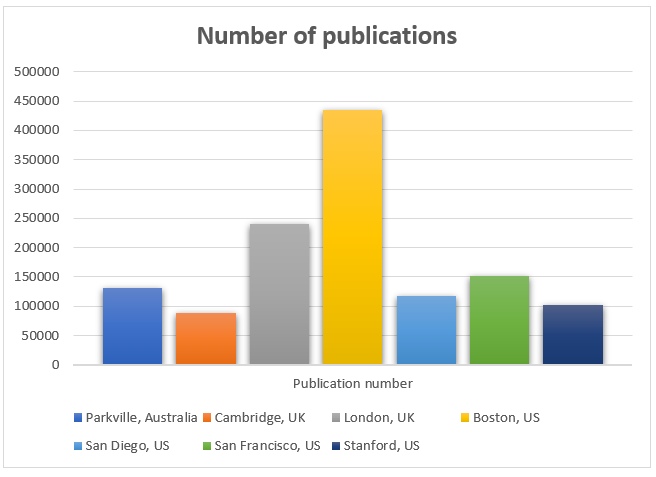
Chart 2. Total number of publications by precinct in 20 years (2000 – 2019)
Source: Incites, A Clarivate product 2019, data as of Nov 2019
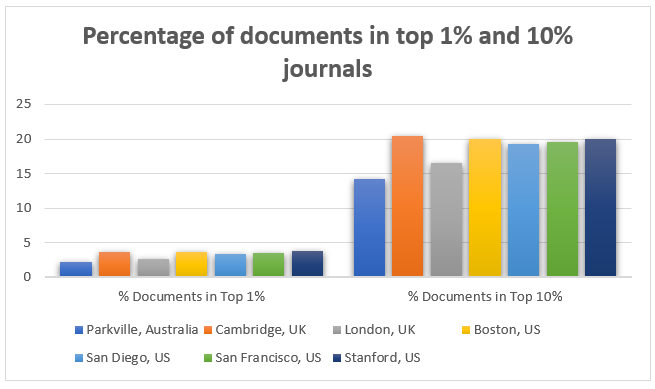
Chart 3. Percentage of publications in the top 1% and 10% by number of citations when normalized to category and year for each Precinct in 20 years (2000-2019)
Source: Incites, A Clarivate product 2019, data as of Nov 2019
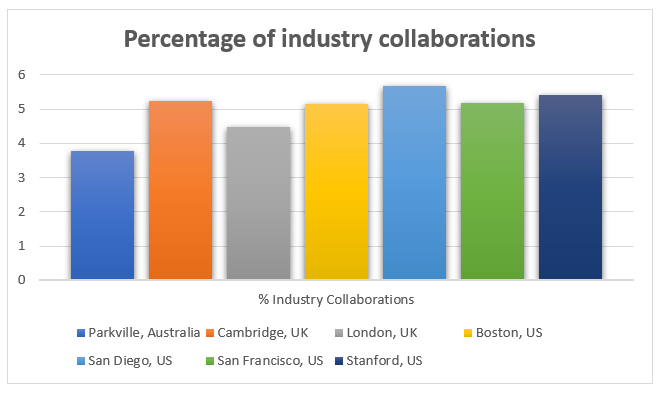
Chart 4. Percentage of Industry Collaborations for each Precinct in 20 years (2000-2019)
Source: Incites, A Clarivate product 2019, data as of Nov 2019
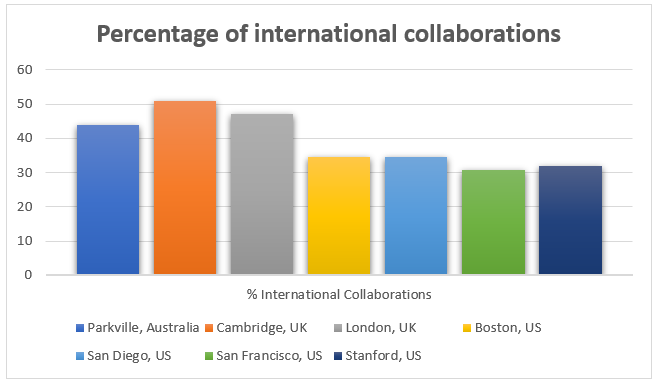
Chart 5. Percentage of International Collaborations for each Precinct in 20 years (2000-2019)
Source: Incites, A Clarivate product 2019, data as of Nov 2019
These metrics indicate that Melbourne is on a trajectory as a top tier innovation- based growth cluster. Our local academic and collaborative framework as shown above is competitive against other renowned and established precincts. This feeds into what underpins Melbourne as a self-sustaining innovation economy centred around Parkville and other heartland clusters.
It takes time, persistence and a growth mindset over decades for innovation in research, policy and economics at all levels to engender a truly dynamic innovation landscape. There are several opportunities upstream and downstream to refine each stage of the commercialisation process to drive success.
In the meantime, sharpening our skills in defining, managing and refining our data insights is an important task for both academic and industry in seeking a true picture of where we are headed and what support is needed to enrich the growth of a flourishing precinct.

Ms Gouri Betigeri
Clarivate Analytics Australia & New Zealand
https://www.linkedin.com/in/gouribetigeri/

